top of page


Investment Table

*These expenditures represent an estimated range of costs across the United States. Please see the FDD for more details.
Average Drive-In Sales


The performance results included here relate to historical results and are not the actual or probable performance results that you should expect to achieve through the operation of your Sonic restaurant.
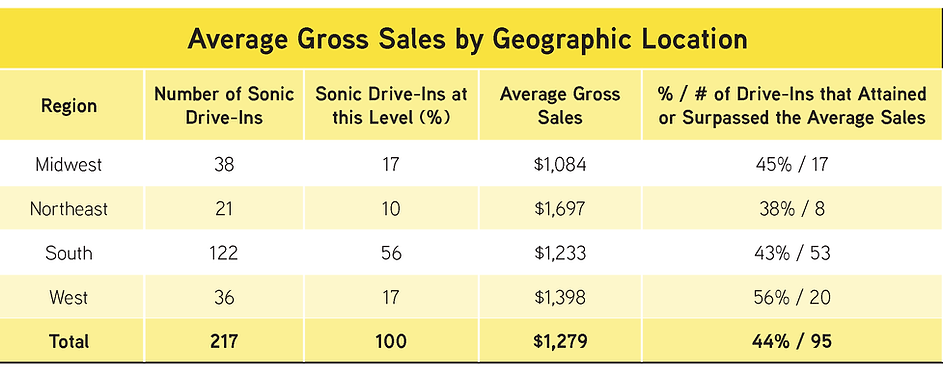
Average Gross Sales by United States Geographic Location For Traditional Franchise Drive-Ins
($ in Thousands)

Average Gross Sales for the 12-Month Periods Ended August 31 (Traditional and Non-Traditional Sonics)
($ in Thousands)

Advertising Contribution

Number of Locations
Franchisee Owned vs. Company Owned

Royalties

Expenses and Operating Profit

bottom of page