top of page


FRANCHISEE INFORMATION
Investment Table

*These expenditures represent an estimated range of costs across the United States. Please see the FDD for more details.
Sales


Return on Investment

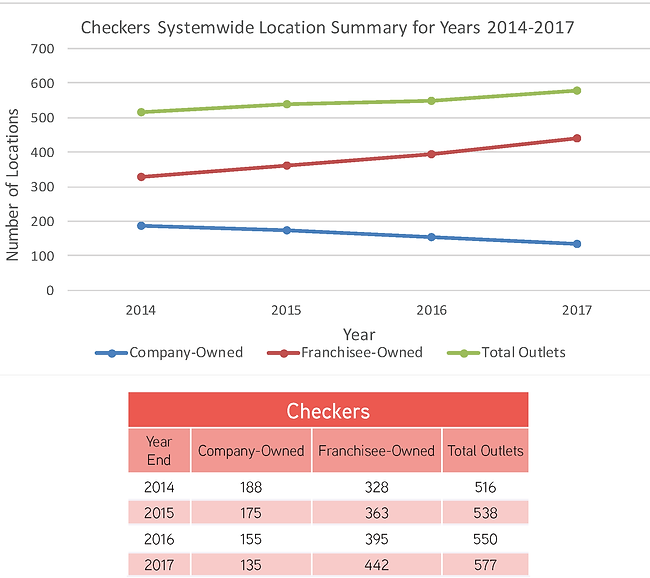
Number of Locations
Franchisee Owned vs. Company Owned

bottom of page